Do You Know Your “A”, “B”, and “C” Team Members?

Not everyone in an organization is contributing to its success equally. In 1906, Italian sociologist and economist Vilfredo Pareto wrote about the 80/20 ratio—80% of the outcome can be attributed to 20% of the causes. We find this ratio in many circumstances, from natural phenomena like the 80% REM/20% non-REM split in adult sleep, to financial examples such as the likelihood that 80% of donations to a nonprofit organization come from 20% of the donors. In the workplace, the Pareto Principle is apparent in the common occurrence that 20% of the team members generate 80% of the production; they are in the right garden, thriving and making a significant difference—they are achieving Peak Performance. Of the remaining 80%, some are in the wrong garden and are struggling, but the largest number are in the middle, seeking more experience and training to close the gap so they can be among the elite producers.
Assessing How Team Members Contribute to Organizational Peak Performance
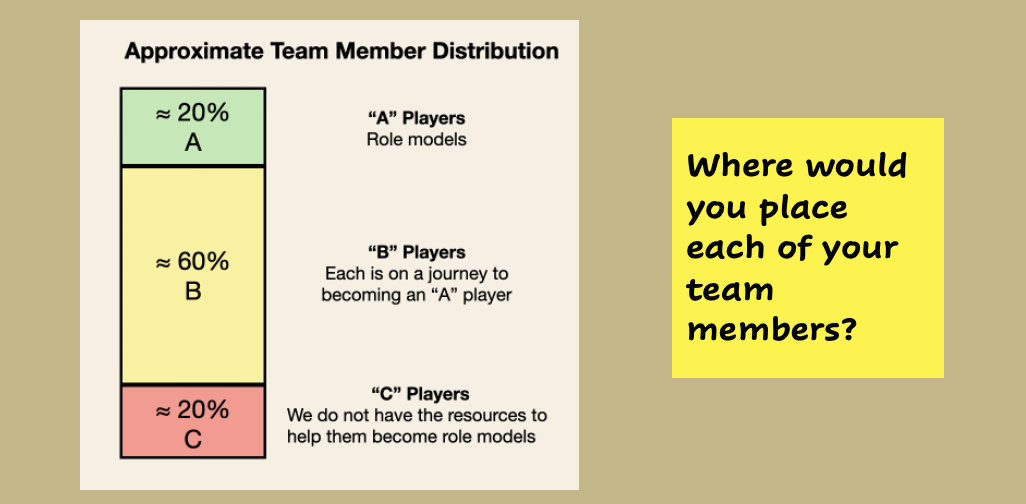
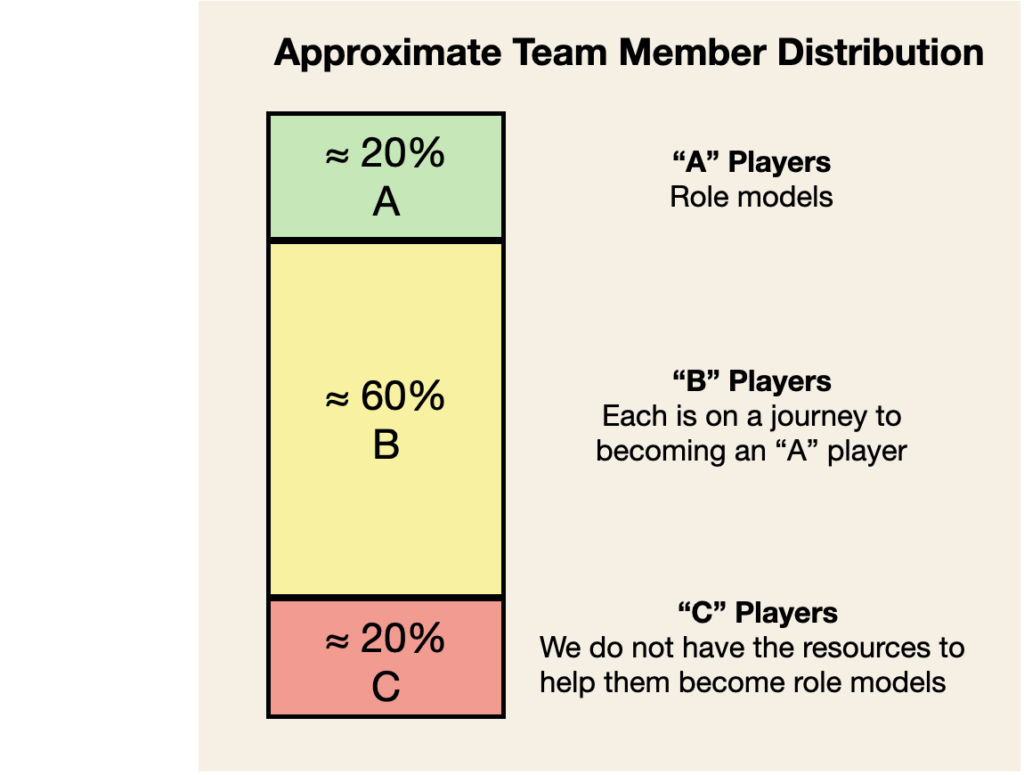
To help understand where each team member is in their contribution to organizational Peak Performance, many in the human resources field categorize “A” “B” and “C” team members as defined below.
“A” Players are role models of Organizational Culture Fit, Job Competency, and appropriate behavior under pressure for their job.
“B” Players can potentially be “A” Players with experience and coaching.
“C” Players do not possess the attributes to be “A” players, or we do not have the resources to get them there.

We worked with the chair of a major academic medical department who, upon hiring, was told, “You can fire every one of your faculty. There needs to be a change in this department.” A mass firing was not necessary in this case, or in any other organization we have worked with; we doubt it would ever be required. The diagram at left represents the approximate distribution of employees at all levels of each of the organizations we have worked with at FS/A.
As Adam Grant shared in his book Give and Take, the drain on energy in an organization from a “C” player (in the bottom 20%) requires the energy of three “A” players (in the top 20%) to counterbalance the drain.
Leveraging Your Organization’s Greatest Asset
Your team members are the greatest asset your organization possesses. How often are you talking about your “A”, “B”, and “C” players, and what you can do to enhance their contribution in service of organizational Peak Performance?
Next week, we will share the incredible opportunity your “B” Players provide. We hope this is helpful to you.


